
Crystal Report designer
The Crystal Reports Designer is an application which provides graphical interface to develop reports and provides flexibility and control during the creation of highly formatted, feature-rich reports.
It includes a complete and rich set of layout and design controls to give the created reports a professional, pixel-perfect appearance without any custom coding, streamline the number of reports by using parameters and organize data in a logical manner using sections, groups and sorting.
The outlook of the ad-hoc chart and map reports is supported by the intelligent charting feature that automatically recommends the best chart type for a given set of data.
For novice users, Crystal Reports includes an intuitive report design expert and a report creation wizard.
For more advanced users, Crystal Reports lets control over most features, including formulas, conditional formatting and object positioning so the reports can be highly customized.
Crystal Reports provides a set of over 35 data connection drivers to any relational, OLAP, XML or in-memory data source. CR provides native, ODBC, OLE DB or JDBC connectivity to databases, files, logs, enterprise applications, program elements or BusinessObjects Enterprise universes.
The underlying SQL for every report developed in Crystal Reports can be customized which provides a complete control over how the data is queried. It is also easy to link data from multiple sources and in multiple languages within the same report.
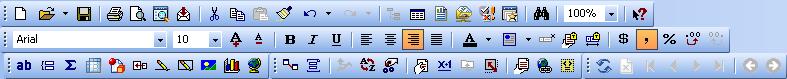
Crystal Reports report designer is composed of the Toolbar, Design tab and Field Explorer and Report Explorer tabs.
Toolbar is divided into Standard, Formatting, Insert, Experts, Navigation bars.
Design tab provides environment for designing a report. Data you want to place on the report is represented by fields that you put in sections of the report. In the Design tab you can also do formatting or specify sorting order and grouping.
Design tab basic sections:
- Report Header
- Page Header
- Details
- Report Footer
- Page Footer
Click here to find more about Sections
Field Explorer is used to insert, modify or delete fields from the report. Database Fields folder consist a list of database tables and columns you can retrieve data from. If you're not connected to the database, right-click on Database Fields folder and select Database Expert. In the Database Expert dialog box select connection to the database or create new one. Select tables you want to use and click OK. Expand the Database Fields folder to see all available objects. To put field on the report drag it and drop field frame on the report or select a field and use Insert Field button from the Field Explorer toolbar.
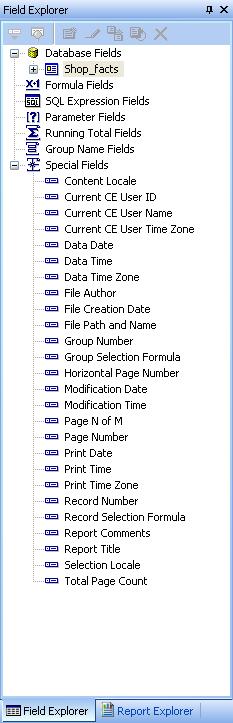
You can switch from the Field Explorer tab to Report Explorer tab to manage sections of the report.
To add Special Fields like page number, print date or comments expand Special Fields folder in the Field Expert tab. From the list of special fields choose the one you want to use and drag-and-drop it in the section where you want to place it.
To insert Text object select Insert Text Object from the Toolbar. Draw the text object frame in the section you want to place it. Fill the frame with a text.
You can also put a picture on the report. To do this click Insert picture button from the Toolbar, browse for picture you want to use and open it. Place the picture frame in a particular section.
To preview the report before printing it, use Print Preview on the Toolbar. Report preview will be generated. You can also preview report in HTML format. To do this, click HTML Preview button.