
Chart expert
You cannot place chart in every design area of a report. You can place them only in headers and footers of the page or report. You can also place them in group headers and footers if you created groups. To create a chart you can select Insert tab, click Chart, than place chart frame on a particular section or right-click on section you want to place the chart and select Insert Chart. You cane also use Insert chart button in the top menu. Every of this actions will open Chart expert dialog box.
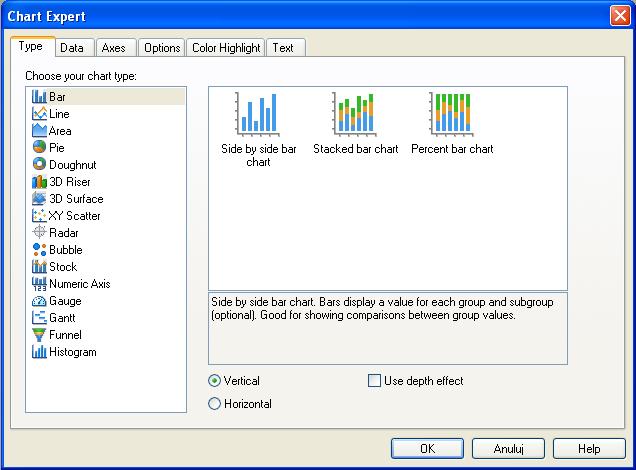
If your chart is already placed on the report you can right-click on it and select Chart Expert. When you have Chart Expert dialog box opened you can see following tabs: Type, Data, Axes, Options, Color Highlight and Text.
In the Type tab you can choose one of many different chart types. In some types of charts you can also choose vertical or horizontal alignment of the bars and weather to use depth effect or not.
- Important chart expert features:
- Data tab gives you possibility to set the advanced options of a chart and choose layout if the chart is based on a specific data source like cross-tab or olap.
- In the Axes tab you customize some options like range of the axes, gridlines or number of divisions.
- In the Options tab you can set colors and size of the bars or type of background. You can also choose weather to show legend or not and set it’s alignment.
- Color Highlight tab gives you possibility to mark fields that fulfit you condition. To create new condition press New button. In the Item editor section choose a value and an operator of a condition. Data that fulfit your condition will be displayed in selected color.
- Text tab lets you type titles and subtitles and specify style, size and type of a font.